Before you start running participants it is important to set up your data collection sheets. There are a lot of different ways to do a statistical analysis, but in our lab we have SPSS which does a lot of work for you (see Figure 3). You can assign specific values a description, such as, 1 for male and 2 for female. This allows SPSS to easily show you the difference between two groups. It is good practice to set it up this way in SPSS and only use the numerical values in your excel spreadsheet and make one page within your excel workbook to hold all the values for each variable along with its assigned coded value (Gender: Male=1; Female=2).
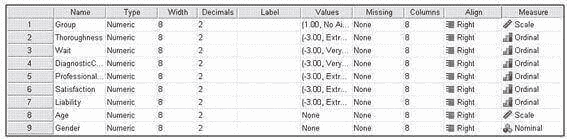
Figure 3. SPSS allows you to set up your spreadsheet by naming variables and also determining the level of measurement. (Taken from SPSS).
It is set up similar to an excel spreadsheet in that the DV's you are examining are across the top (see Figure 4).
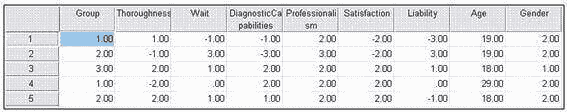
Figure 4. Once your spreadsheet is set up in SPSS you can view it and model your excel spreadsheet after it. (Taken from SPSS).
It is good practice to set up both your SPSS spreadsheet and your excel spreadsheet to be the same (see Figure 5). This will allow you to copy and paste your data into SPSS for quick statistical analysis.
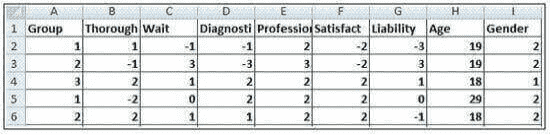
Figure 5. Model your excel spreadsheet after the one in SPSS. You can simply copy and paste your data into SPSS and quickly perform your analysis. (Taken from an Excel spreadsheet).
REFERENCE
The following reference is useful with conducting statistical analysis as it tells you which options to use and the basics for each test covered.
Cronk, B. (2011). How to use SPSS (7th ed.). Pyrczak.
